


"Thanks to the OVI and WiseTraders strategies, I've been able to secure a return of 1,428%. I took my account from $3,000 to $45,830 in just 30 months. These profits have allowed me to realise my dream of travelling to Europe and I am now more hopeful of achieving financial freedom."

"Trading with just Guy's system, I've made over $685,000. It has been most profitable and is much the reason I can now enjoy a comfortable retirement. It takes me about 30 minutes a day and remarkably little stress. I have never seen anything so good in 30 years of trading."

"I have been a full time trader for 14 years and have made about every mistake you can. But the best decision I ever made was to take a chance on WiseTraders and OVI. They care about your success, provides an excellent product, training and support. I am making real money and have an unbelievable win rate this year. All I can say is it works for me and I do not use any other product, plus I am not glued to the screen all day. Check it out."

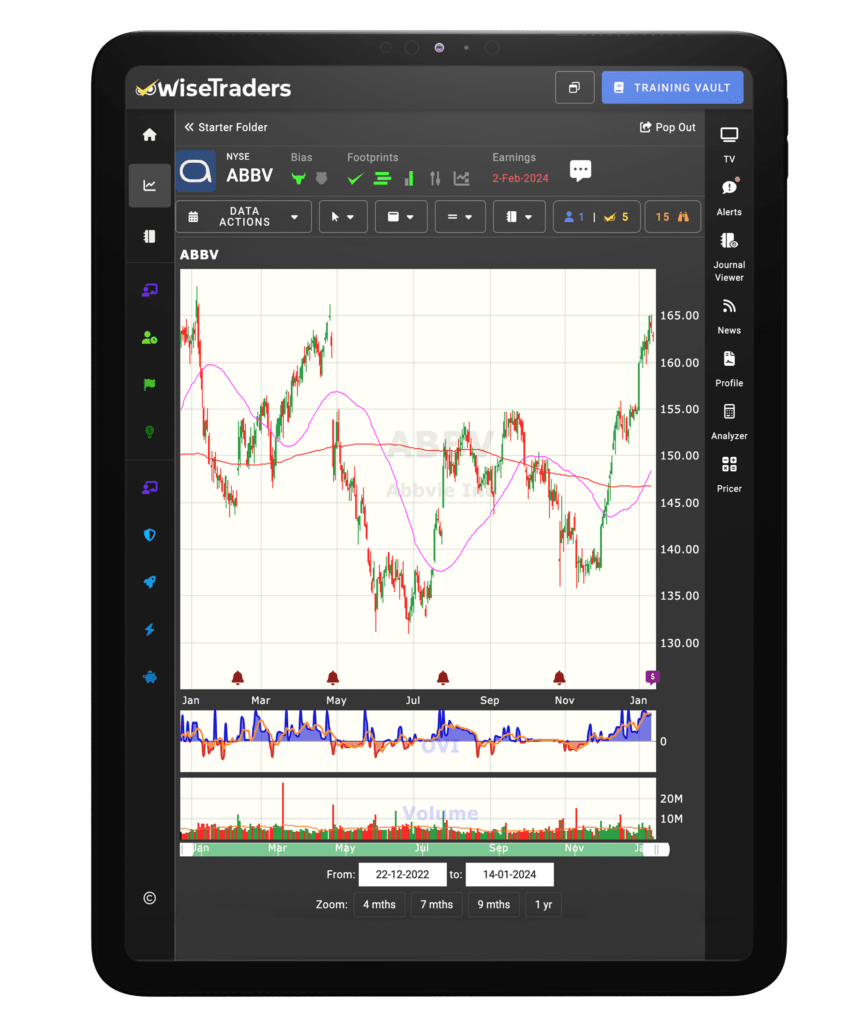
"As a senior manager in a global IT company, it's obvious to me that the Wisetraders team actually use their own software. Their site has "next level" searching, charting, pattern recognition, and much more in a super visually pleasing format to find positions with the best odds of success. I believe it is the best I have seen for searching and finding optimal positions and entry points. Kudos!"